
Test One: Antenna Return Loss (S11)
Antenna Characterization


Test One:
Antenna Characterization
Antenna Return Loss (S11)

Slide 1 of 4
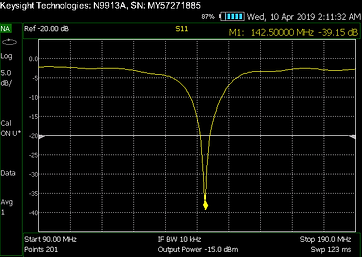
This test compared the two fixed length antennas that we ordered. The first and more expensive antenna being the PulseLarsen Antennas model number NMOWB150B and the second being the Diamond Antenna model number M285SNMO. Both antennae had vague datasheets which made it difficult to determine if either antenna would be adequate for PLAD. We used a Keysight Technologies 4 GHz Fieldfox using the NA mode. We tested the antennas while mounted on the roof of a 2005 Toyota Tacoma with a magnetic mount base. From the results we determined that the Diamond Antenna had a superior S11 measurement, similar bandwidth (BW), and a much better impedance match. From this information we decided to move forward with the Diamond Antenna model number M285SNMO with the remainder of the testing. This data can be seen on the data page, click on the image to see more.


Test Two:
Noise Floor vs FFT Size
Results

Slide 1 of 2
This test measured the effect on the noise floor of the device as the number of Fast Fourier Transform (FFT) points increased from 256 points to 32,768 points. As expected, when the number of FFT points increased the noise floor was reduced. The average noise floor reduction was ~3 dB for every doubling of FFT points. It is important to reduce the system noise floor to increase the sensitivity of the device. This aided in three critical points for our project: reducing the likelihood of false positives in our detection algorithm, defining where the positive detection threshold should be, and determining the appropriate number of FFT points to use. It is important to determine the proper number of FFT points because as the number of points increases so does the time of each possible sample. This is covered in more depth in the next test.

Test Three:
Sample Time vs FFT Size
Results
Slide 1 of 3
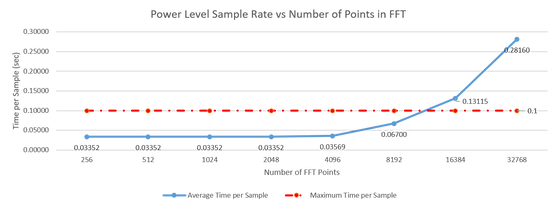
This test was designed to work in conjunction with test two above. This test provides you with insight to how long a single sample would take. As the number of FFT points increases the noise floor decreases while the sample time increases. Our goal is to find the ideal balance between a low noise floor and fast sample time.The maximum allowable time per sample to meet ER3.1, Detect an arc from a vehicle moving 50 MPH, is 100 ms.
While the FFT point number of 8192 provided a lower noise floor than 4096, it doubled the time per sample. This is why we selected a 4096 point FFT, because it lowered the noise floor to ~-82 dB while maintaining the fastest possible sample rate of ~35.7 ms.

Test Four:
GPS Validation
Results


Here we wanted to determine the accuracy of our GPS unit. The GPS unit is a critical component in the system architecture, and critical to accurately identifying the location of faults. The two GPS units were accurate to 4.87 meters. It is important to note that the accuracy of any GPS unit is increased when there is movement of the device. Both test units we placed on the hood of a stationary vehicle and therefore, the accuracy of both units was reduced. However, the accuracy of 4.87 meters is approximately 16 ft which satisfies ER4.1, displays weighted values on heat map within
50 feet of fault. Therefore, the GPS used satisfies our projects requirements. Because the Gumstix GPS unit uses the U-Blox NEO-7P GPS module it updates at a maximum of 10 Hz which satisfies ER3.2.
Slide 1 of 2

Test Five:
Detection Angle
Results


Slide 1 of 3
This test was designed to confirm that the selected antenna would be capable of receiving the desired signal. The average distribution network power line is 37 feet from the ground and our maximum distance away from the power line would be 75 feet and the minimum distance tested would be 15 feet. This produced angles ranging from 21.8 degrees to 63.43 degrees. It was predicted that our mono-pole antenna, placed on a ground plane (the roof), should easily detect the signal. This was proved to be true for the angles of detection required. This test also helped us to determine the value at which our detection threshold should be set.

Test Six:
Large Signal Overload
Results
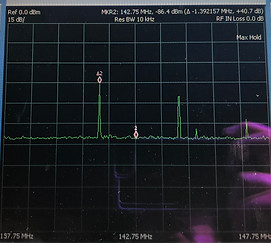
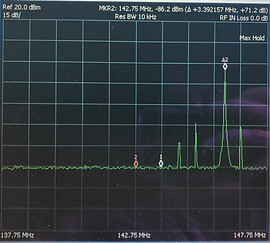
This test was intended to identify what, if any, competing signals may exist in the area under test. 142.5 MHz is identified as fixed maritime mobile in California as per FCC allocation chart found here:
https://transition.fcc.gov/oet/spectrum/table/fcctable.pdf
Because of this we were expecting to find nothing in the range below 144 MHz. We did however, find a narrow band signal while near the Coast Guard facility in Petaluma CA. We found some small signals as well in the amateur radio band above 144 MHz. None of these signals overloaded our ADC or caused false positives in our system.
Slide 1 of 2

Test Seven:
Data Stream Update Rates
Results
As found earlier in the tests the power level update rate was confirmed as being less than the maximum of 100 ms, at 35.69 ms. The GPS data stream also needed to be confirmed. The datasheet indicated that the maximum update rate was 10 Hz or 100 ms. This was confirmed through testing on the U-Blox U-Center software used to configure and test the U-Blox GPS chips.
Slide 1 of 2

Test Eight:
Maximum Route Layer
Update Rate
Results
Slide 1 of 2
This test was intended to confirm that the route layer of the map updated at a rate less than ten seconds. The average update rate for the route layer was found to be 5.35 seconds.
35.69 (ms/sample) x 150 (samples/update) = 5.35 (sec/update)
This was well below the maximum desired update rate of ten seconds.

Test Nine:
Pin Drop Resolution
Results
The maximum point resolution of the system for the route map layer was found to be 392.59 (ft/sample). This was just below the maximum of 400 feet per route layer point. The update rate of the GPS was found to be once every 7.33 ft, at 50 mph. Because of the GPS running on a separate thread in the code, it can be polled and guaranteed to be updated every 100 ms. This allowed the system to collect the GPS data and power level data and store it such that the map resolution would not exceed 400 ft between points on the route map layer at a maximum speed of 50 mph.
Slide 1 of 2
Test Ten:
Battery Life Test
Results
The System was found to run for an average length of 9 hours and 41 minutes. These results exceeded our minimum requirement of operating for the length of a typical 8-hour work day. The battery system is designed to keep the system operational while temporarily stopped for breaks, lunch, or at normal service calls. The PLAD system would operate from the standard 12 volt receptacle located in the vehicle during normal operation.
Slide 1 of 2

Test Eleven:
Mounting Time
Results
The average mounting and installation time was found to be less than two minutes. The maximum allowable time as per the marketing and engineering requirements was 20 minutes. Therefore, our mounting and installation time was less than one tenth the maximum.
Slide 1 of 2